Sidebar. Spectroscopy – determining chemical elements in stars by absorption and emission of light at discrete wavelengths
Electrons around atoms assume discrete steady states – described by the orbits of older quantum mechanics and by the more complicated exact wavefunctions in modern quantum mechanics. Electrons can be bumped into states of higher energy by the absorption of light particles or photons with the energy content that exactly matches the extra energy in the new electronic state. The photon energy is related to its wavelength, λ, and its frequency, ν (nu), as E = hν = hc/ λ; h is the universal Planck’s constant, 6.62×10⁻³⁴ joule-seconds and c is the speed of light, 3×10⁸ meters per second. Conversely, the electrons can drop down from an excited state to a lower-energy state, with the emission of a photon of the exact amount of energy so released.
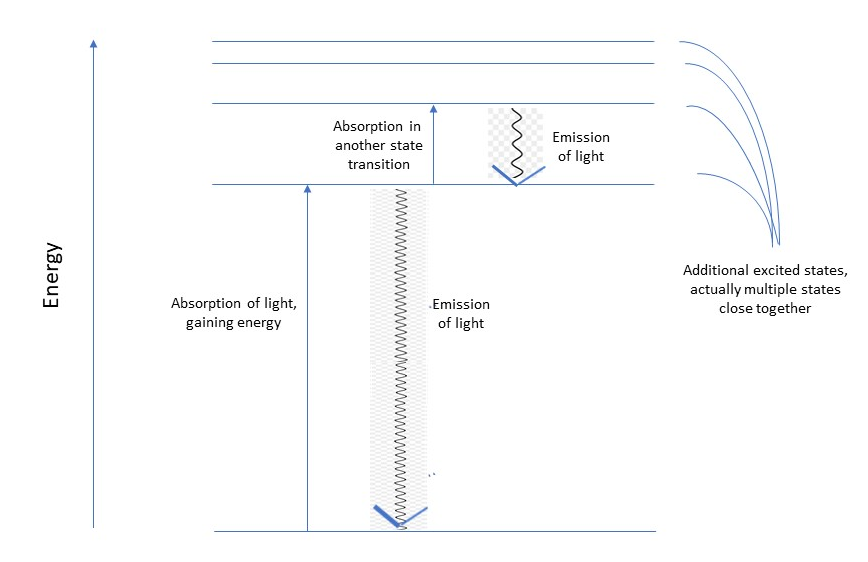 In both cases the event occurs at a very precise wavelength of light that is characteristic of the chemical element and of its state of excitation. The intensity of the absorption or emission is also characteristic and is proportional to the amount of the element in the given electronic state. Thus, a measurement of the intensity gives us the abundance of the element along the line of sight. There are complexities involved in absorption along the way to our telescopes but these can be calculated, cleverly if I may give credit to the astronomers.
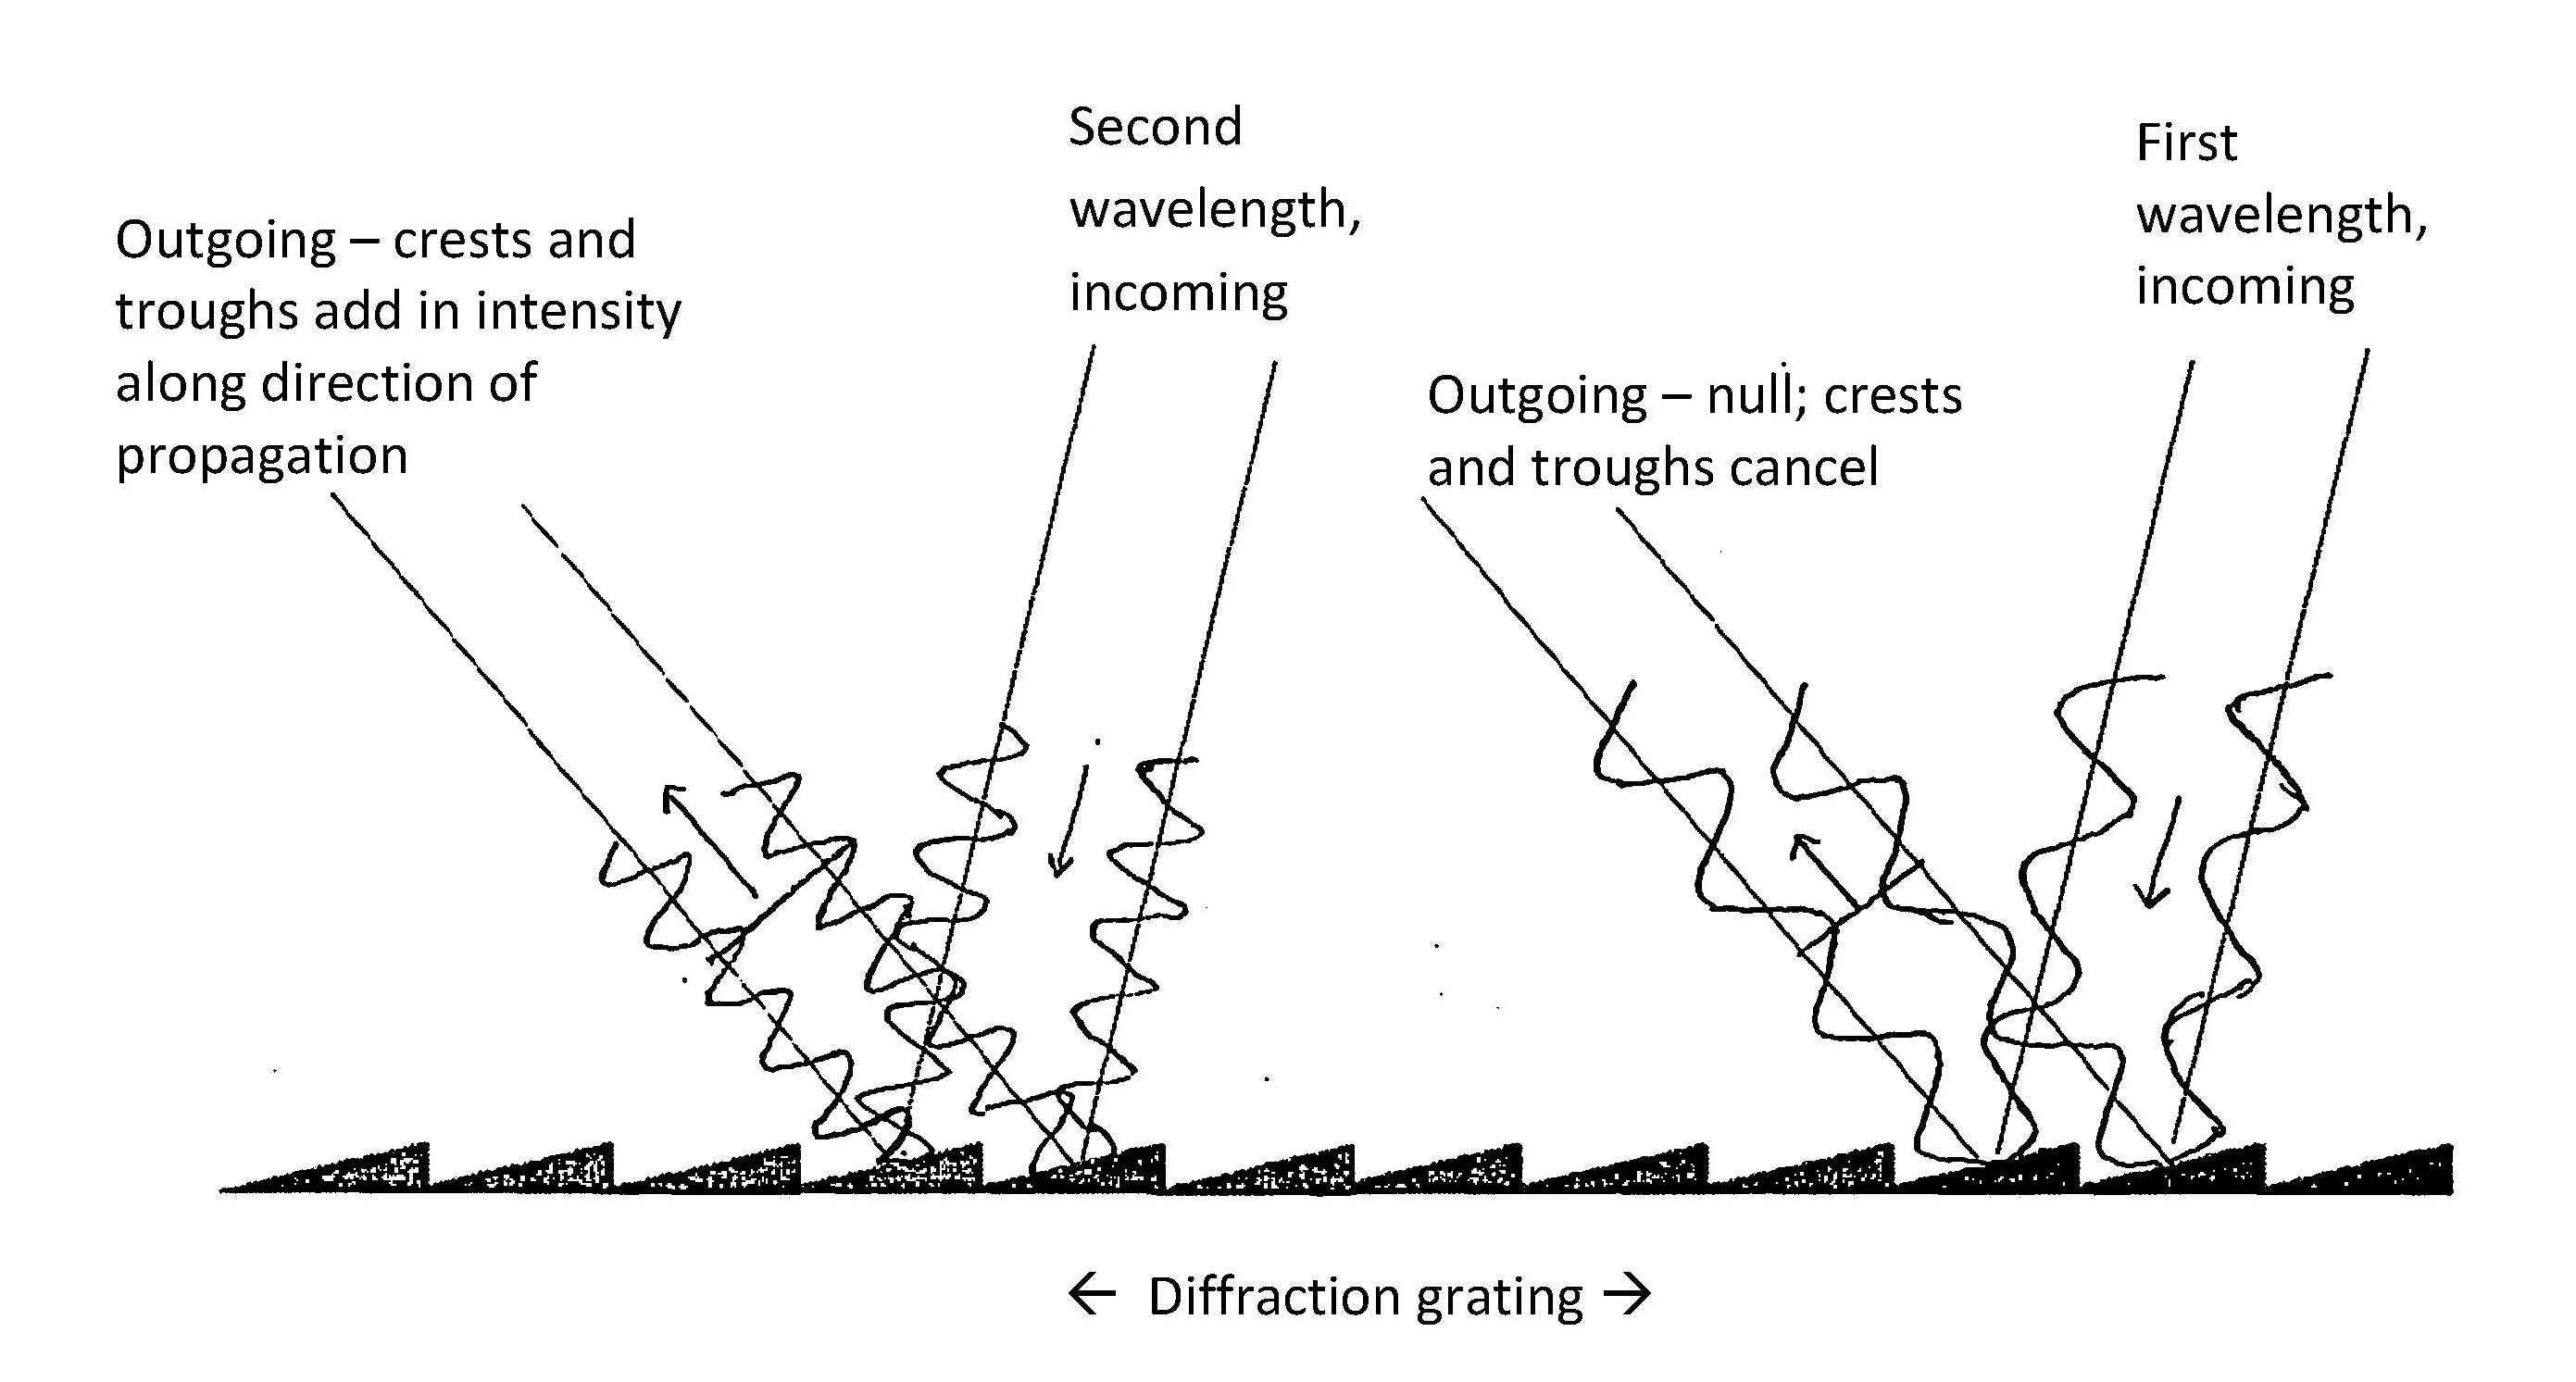
To detect the elements’ abundances and states of excitation we have to measure the intensity of light over a wide range of wavelengths. That needs to be done with very fine resolution in wavelength and fine resolution in intensity. Light can be dispersed over a distance several ways. One is with a common prism, but that has quirks such as uneven spreading rates across wavelengths. The best method is diffraction. It relies on the patterns of interference among light waves. Let light fall on a diffraction grating, which has many small slopes that each scatter light. Light waves have phases, just as do water waves. Waves that meet from different sources add algebraically. Waves meeting in phase add up and are intense. Waves meeting out of phase cancel each other in part or in whole. Choose a wavelength and you will find that the waves add up at certain angles:
 A compact disc or a DVD is a wonky diffraction grating, by virtue of its finely spaced lines of pits

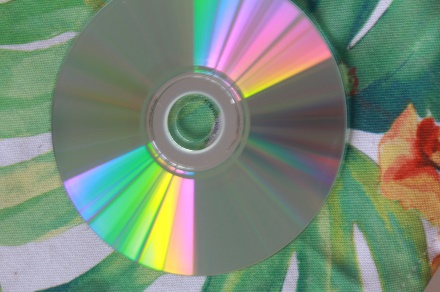
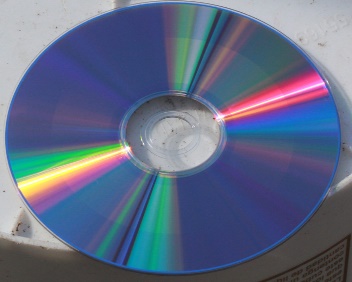
Sunlight, good red-green dispersal Sunlight, good green dispersal Window light, just pretty
Spectral resolution is poor, from the wide range of arrival angles
With a good diffraction grating a resolution of a millionth of the span of wavelengths can be reached. Still, it’s hard to make a good diffraction grating by scratching (a crude way to put it) lines across a piece of material. Modern spectrometers use instead a solid body, rather translucent, with regular patterns of changes in refractive index imposed by interfering laser light.
Once the light is scattered with light of different wavelengths (colors) at various positions, the light intensity must be detected quantitatively. In the past this was done withy photographic film. It’s now done with electronic detectors much like photocells in consumer goods. To record a spectrogram, as it’s called, the telescope has to stay focused on a star. To make efficient use of the telescope the light from many stars at a time is captured, each one sent to its own detector over a fiber optic cable. There are 132 cables in OzPoz used in the European Space Observatory’s Very Large Telescope in the high mountains of Chile.
A spectrogram can be extremely long and detailed. Here is one of our Sun, chopped into segments and stacked. Red is of course the longest wavelength and violet the shortest. The dark gaps from absorption of light by various elements in various states are known as Fraunhofer lines.
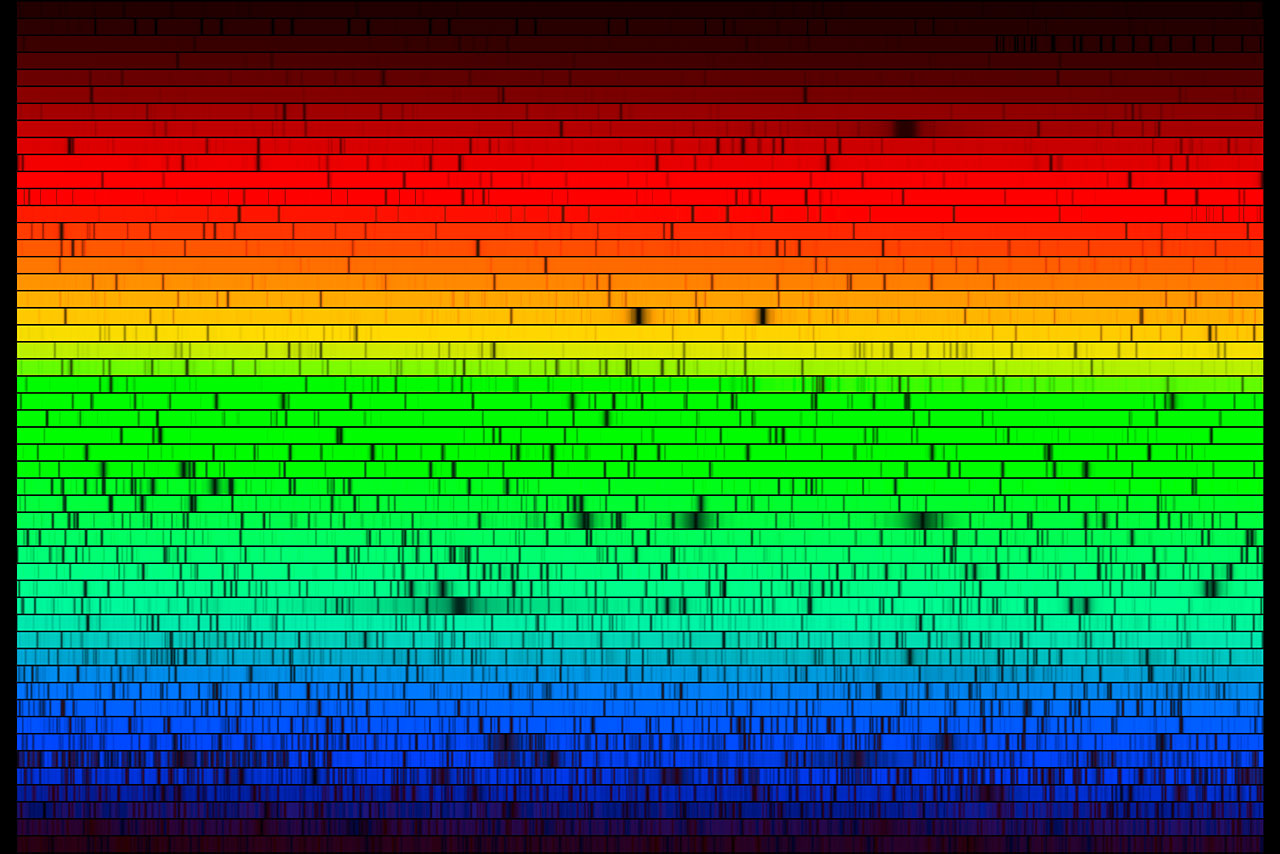
The barcode of the Sun. A very long spectrum was chopped in small chunks and then displayed one on top of another. Credit: NOAO/AURA/NSF
Finding elements in the stars was illuminating enough. In 1868 Jules Janssen and Norman Lockyer both discovered helium in the Sun’s corona, before it was found on Earth. In the 1920s, Cecilia Payne- Gaposchkin measured elemental abundances in many stars and found that they are mostly hydrogen. (I highlighted the sad story of sexism in accepting her findings and giving her credit in a radio spot in 5 May 2020.) The abundances of the elements in various states tell us many things. One is the temperature of the star. Higher temperatures push elements more into excited states. Another is something of the history of the star – how much has it created new elements by fusion (related to age, then, and star processes), and how much of given elements has it inherited from “ancestor” stars that exploded and therefore was left as material for the pre-stellar nebula to incorporate into the star at its time formation. Our Sun has not made any zirconium, for example, but zirconium is detectable. Its amount and the amounts of other elements tell us that a supernova or a neutron-star merger happened before our Sun was formed. That also gave us all our nice rocky elements on Earth.
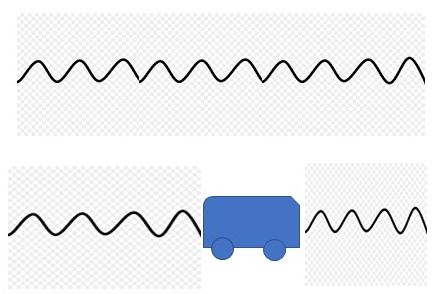
There’s more information embedded in the spectrogram. If the star is moving relative to us, the wavelength shifts. The incomplete analogy is to the Doppler shift in the frequency of sound from a moving source such as a train. Distant stars are receding from us; their light shifts to longer wavelengths, more toward the red if we’re talking about visible light.
The redshift gives us a measure of velocity. That gave us the concept of the expanding Universe and the Big Bang. Stars can also move periodically, such as when binary stars swing around each other in a mutual orbit. That, too, is quantifiable and helps us measure the mass of stars nicely. More random motions in star or a star system or galaxy broaden the absorption and emission lines. The breadth can tell us more about temperature and some other processes in a star and about the distribution of velocities of the various stars in a galaxy, including our Milky Way. Relevant to habitability studies, a very recent interest is in the absorption of light from a star when one of its planets moves across its face. This gives information about the atmosphere of the planet. To date we have very few data points.
The absorption lines from the Sun give us some narrow clear spans of wavelength in which satellites can measure strong light coming from plants – the fluorescence of chlorophyll that tells us how well the plants are functioning. This is related in the main text.