Sidebar: Power laws for the scale of things
A power law simply expresses the relation of two quantities, one of the with an exponent. Examples include:
- Ohm’s law for electric current being proportional to the first power of the voltage and the minus-1 power of the resistance: i = V/R
- Kinetic energy related to the second power or square of the velocity of a body: E = ½mv2
- Intensity of radiation from a point source falling off as the minus-2 power or inverse square of the distance from the source: I = A/r2 = Ar-2
Mean distance traveled by a diffusing particle varying as the ½ power or square root of the elapsed time:- Flux of energy (energy density) from a blackbody as proportional to the 4th power of the absolute temperature: I = σT4
There’s no need for the exponent to be an integer or a simple fraction. Complex chains of causation may lead to non-integer powers, and only approximately so or only as a good fit over limited ranges. Examples include:
- The relations of stars’ masses to core temperature, radius, and lifetimes, as cited in the text;
- Metabolic rate of a mammal as proportional to total body mass to the 0.7 power or something close to that : M = Am0.7. There’s a fair amount of scatter “off the line” – e.g., sloths are below the line, shrews are above it
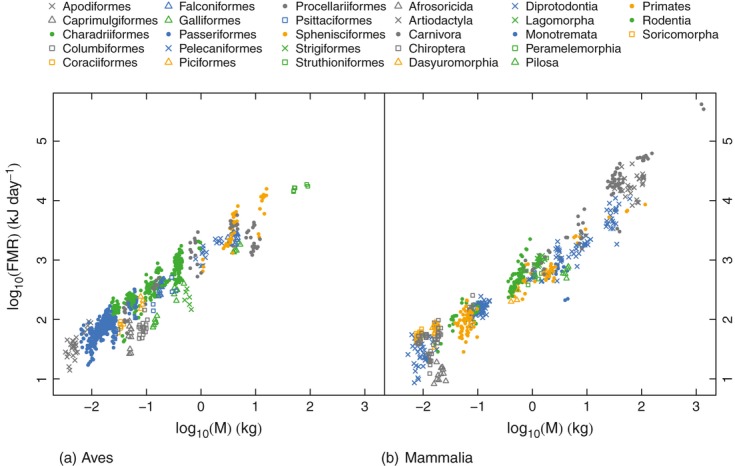
L. N. Hudson et al., J. Animal Ecology (2013)
The plot that lets us retrieve such a scaling relation is the logarithm of the “response,” the metabolic rate, vs. the ”driver,” the body mass. That can be shown with a bit of algebra and logarithms. Let the metabolic rate be approximated as A mb. Then let’s plot log(m) (in base 10 or base e, whatever) against log(m) = log(A mb) = log(A)+b log(m). This gives us a graph with a slope of b. One has limited trust that the relation is sufficiently accurate for prediction outside the range of the data used or for a new individual case (a new animal, not in the original dataset) – look at the deviations from a straight line through the data. It might be about 0.3 units in the logarithm in the data above. That corresponds to an absolute variation of 100.3, which is close to a factor of 2 (or ½ in the opposite direction).