Appendix: How heat moves through soil and rock
Let’s consider a few cases. First is the daily heating and cooling of the soil surface, with sunlight providing the heating, primarily, and with thermal radiation and air circulation (convection) providing the cooling. The temperature of the soil surface varies rather regularly over a run of similar days (that is, not considering times of rain, or weather fronts moving in; a more comprehensive accounting of these as drivers is possible). Example: in Las Cruces on a clear, hot, summer day, the soil surface may heat to 70°C by mid-late afternoon and drop to 20°C by dawn.
To do a simple analysis, we’ll approximate the behavior of the surface temperature as a simple sine wave. Here’s a plot, showing it as an approximation to a real trend:
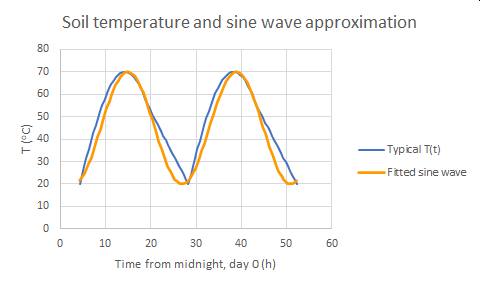
Fig. 1. Soil temperature, hot summer day, Las Cruces, NM, USA
Soil temperature, hot summer day, Las Cruces, NM, USA
We’ll write an equation for temperature at the surface, T(0):

The assumption here is that temperature hits the mean value at 10 AM (t=10h). This is rough, in that temperature will hit its minimum at about 5 AM local solar time, its peak at about 4 PM, and its midpoint around 10:30 AM. I’ve put explicit units in the math, which is unusual but serves to orient us.. In the lower version I used a generic form, with the half-range of the swing at A, the midpoint time as t0, and the period of the swing as τ – which is 24h or 86400 seconds for a daily swing, or 31.5 million seconds for the annual swing (and the annual swing is between about -10°C in winter (lower than air temperatures, with the radiative cooling to the sky) and +45°C in summer, for a mean of about 17.5°C (the real mean is 15°C, so, we’re close). Note also that the real curve of the surface temperature is not a pure sine wave. It can be represented as a combination of sine waves of different frequencies – that is, a Fourier series. All the results for individual waves can be added together because the equations (below) are linear in temperature – non squares, cubes, etc.
This surface temperature drives heat into the soil below at the hot times of the day and extracts heat in the cooler times. On average the same amount of heat goes in over the hot time as is lost over the cool time, giving us a stable average temperature. There is a slow trend, of course, with the season, but that can be accounted by making A another sine way with the period of one year.
Now we need to capture in math how heat moves in soil (or rock, if we’re in a rocky place such as much of the Sahara desert – nope, sand does not dominate by total area). We’ll take the simple case of a uniform soil – uniform in properties across some significant width and also uniform with depth. There are two properties then that determine how heat moves. One is the thermal conductivity of the soil. We give it the symbol kth. It varies with soil type and with water content, as noted below. For an order of magnitude estimate we might use 2.5 watts per square meter, per unit gradient of temperature of 1 degree per meter. That is, kth = 2.5 (W m-2)/(1K m-1) = 2.5 W m-1 K-1. You won’t need to worry about the units, given that we’re using metric (or SI) units that always come out right with the minimum of care!
The rate of heat transport across an area of soil is then
![]()
This is calculus notation for the rate of change of temperature with depth into the soil, x. If you haven’t done calculus, think of it as with ΔT as the shift in temperature over an interval Δx in depth. In calculus we don’t have to use a grid of distinct points. We take the limit of separations becoming small (infinitely so, which made for interesting objections to Newton’s calculus at first… and for a long time, really).
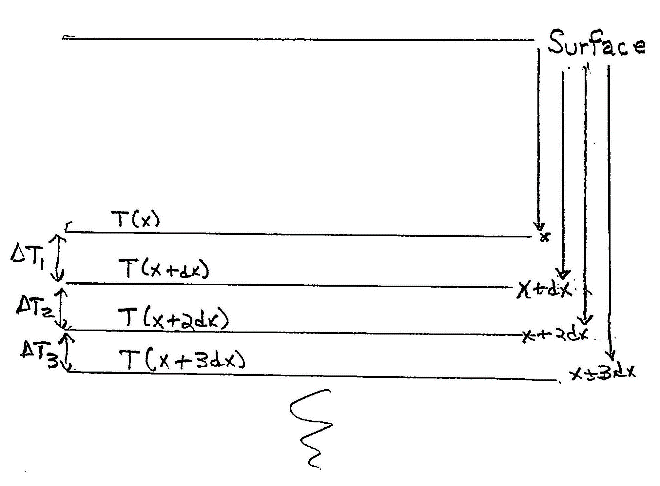
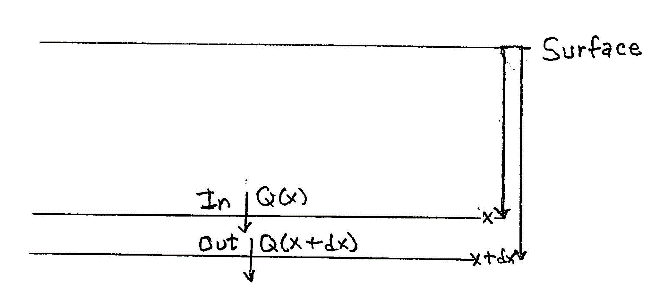
Fig. 2. Discrete set of depths, before taking limit Fig. 3. Heat balance in discrete slab
Now we have to describe how the heat that moves changes the temperature of the soil that’s at some depth x (Fig. 2). We’ll take a thin slab between depth x and depth x+dx, with dx being small so that T changes negligibly from top to bottom. At this point we’ll have to go a bit deeper into calculus, but you can skip to the answer if you wish. We now have two variables, depth and time, so that temperature is a function of both of them T=T(x,t). To describe rates of change we now use partial derivatives. Instead of writing the heat flow rate as -kth(dT/dx) we’ll write it as -kth∂T/∂x. The term partial means looking at variations only in depth, x, at a fixed or constant time, t.
Figure 3 here shows the balance of energy. At depth x there is a flow rate per area Q(x )= -kth(∂T/∂x), with the derivative being evaluated at that depth. That’s going into the thin slab. At the slightly greater depth the flow rate per area is of the same form, Q(x+dx )= -kth(∂T/∂x), but with the derivative evaluated at the greater depth. That heat is leaving the thin slab Now, for any well-behaved function, f(x), its value at x+dx is f(x) = (df/dx)dx. Using this with f(x) being that derivative, we get an expression involving the second partial derivative. For a useful way to combine it with the rate of temperature increase, we’ll formulate the flow of heat for a given total lateral area, a. The heat entering minus the heat leaving is:
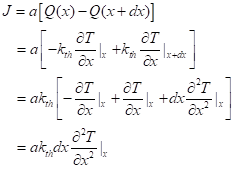
Now we have to compute how that net inflow of energy changes the temperature of the thin slab. That’s simply the rate of change of the heat capacity per volume, CP, multiplied by the volume, which is a dx. Now, assuming the heat capacity varies minimally with temperature, we get
![]()
Now we equate the two expressions, after which we can cancel out terms in common, to get the equation for heat transport under our mildly simplifying assumptions:
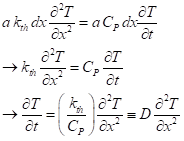
The quantity D is called the thermal diffusivity, with units of square meters per second, just as the diffusion constant for molecules. Diffusivity increases with conductivity, naturally, and decreases with heat capacity (more energy is taken out per unit temperature rise). For the solid, moist soil or rock we can expect a heat capacity of about 2.3×10⁶ J m-3 K-1. Combining that with kth = 2.5 J s-1 m-1K-1, we get a representative value of D as 1.09×10⁻⁶ m2s-1.
Now we need to solve this equation for the prescribed behavior of the surface temperature. Without deriving it, I offer the solution as
![]()
Here, e-x/D is the exponential function, and d is the damping depth, to be determined. Plugging this into both sides of the equation, we get
![]()
Only the sin term has a time-dependence. the expression cos(●) leaves the complicated argument of the sin condensed. That argument is the same in all the expression we will obtain.
For the other side of the equation, we get, first,

The first term on the right-hand side comes from differentiating the exponential and the second term comes from differentiating the sin. Now differentiate once more:

Equating the two forms:

So, the damping depth increases with diffusivity, which makes sense, and decreases with the frequency of the variation (there’s less time to spread before a reversal). For the daily cycle, the angular frequency ω is 2π divided by the length of the day, 86400 s. That gives us ω=7.27×10⁻⁵ s-1, and then d=0.17 m, or 17 cm. Here are plots of T(x) at different times of day:
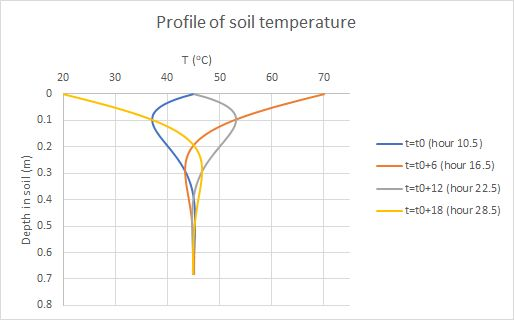
Fig. 4. Simulated soil temperatures at four times of day
Fig. 4. Simulated profiles of soil temperature, four times of day
We can do the same analysis for the annual cycle, for which the amplitude is similar, Aannual = 27.5°C but the period is 365 times longer. That gives a damping depth that is greater by a factor ![]() =19.1, or 3.3 m. There may be smooth sine-like trends over a century, with a penetration depth 10 times longer, or 33 m. In fact, measurements of soil temperatures down to a hierarchy of increasing depths have been used to infer the daily, annual, and multi-year trends in temperature.
=19.1, or 3.3 m. There may be smooth sine-like trends over a century, with a penetration depth 10 times longer, or 33 m. In fact, measurements of soil temperatures down to a hierarchy of increasing depths have been used to infer the daily, annual, and multi-year trends in temperature.
Second case: a permanent heat source pushes heat into a body, such as the surface of a planet that is tidally locked to face a star continuously. The actual solution is mathematically rather complex, but we can get an order-of-magnitude estimate, particularly of how long a heat pulse might take to reach the core of the planet. We’ll treat the planet as a planar slab, as a quite crude averaging. The heat pulse is not a sine wave. Rather, the condition at the boundary is a constant flux, not a constant value. Too get a really crude estimate of the time for heat to reach the interior, we’ll use the same formula for damping depth. We’ll set the depth as, say, 2000 km, use the same D = about 10-6 m2s-1, and solve instead for the time, first solving for the frequency:

That’s 800 billion years. Even with some substantial correction factors to account for realistic geometry and proper boundary conditions, we see that solar heating from the outside of a planet is monumentally slow.
Third case: a planet heated from the inside by a permanent source. That’s the case of the Earth’s geothermal heat flow driven by four sources of heat. The two most important ones are radioactive decay and the original heat of accretion from all those dust particles up to planetesimals crashing together to give an extended body in space, the Earth. The main elements decaying are uranium (two isotopes, 235U with a half-life of 700 million years and 238U with a half-life of 4.5 billion years), potassium (40K with a half-life of 1.25 billion years, and thorium (232Th with a half-life of 14.05 billion years). Their importance has changed over time because the elements have different rates of decline
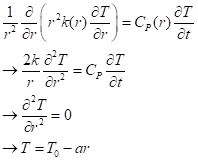
We may consider as a rough approximation (fairly good near the surface) that there is a heat source that’s nearly constant in time and pretty even over all angles, only dependent on depth withing the Earth, that is, the radius from the center. We then use the equation of heat transport in spherical coordinates. Assuming that only the radial coordinate matters, we can write it (without derivation here) as
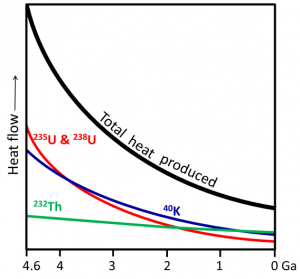
Fig. 5. Heat production by radionuclides in Earth’s interior. Opentextbc.ca/geology/chapter/9-2
Opentextbc.ca/geology/chapter/9-2
On the second line I took the conductivity and the heat capacity to be independent of r, which is fair for a short range of r. On the third line I took the temperature profile to be steady, independent of time. That gives the third line, which has the simple solution that temperature decreases linearly with distance from the center, or, conversely, that it increases linearly with depth from the surface.
We can solve for the rate of change with depth by using the measured average of the geothermal heat flux at the surface, 60 mW per square meter. Equating that to the expression for heat flux, we get
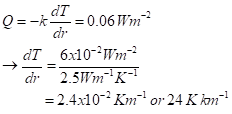
There’s a lot of interesting geophysics and geochemistry in this:
- The measured value is essentially exactly that! Simple physics and the properties of rock give us that nice concordance.
- We quickly see a limitation of the solution: At only 200 km depth out of 6400 km to the core, the temperature would be about 5000 K! That’s not so. Why?
- The actual rate of change over most of the distance toward the center is close to 1 K per km!
Fig. 6. Profile of temperature through the Earth radially. opentextbc.ca/geology
chapter/9-2
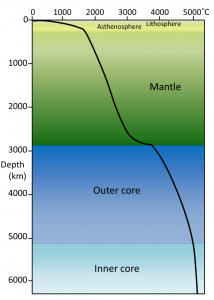
- That is lower because the diffusivity of heat is much increased by the rock in the mantle and the outer core convecting, turning over like boiling water in a pan heated from below.
- How is all this inferred, given that we haven’t as humans drilled further than 12 km down (the Kola Hole, by a team of Soviet geologists over 1970 to 1992!)?
- We know properties of rock – chemical composition, heat conductivity, viscosity, and such from views through the Earth on diverse paths provided by earthquake waves. That’s a long story, which I’ve touched on in another post.
- That nice convection (well, mostly nice) gives us plate tectonics, with features important to us:
- The early scraping up of crust to give us continents that we can stand on!
- Renewal of the Earth’s surface to recycle chemical chemical elements that are largely immobile (phosphorus, a number of metals) but important for agriculture.
- The interesting ride of the continents and ocean floor that isolated or merged species’ ranges during evolution and that changed climates – hence, dinosaurs in Antarctica, marsupials in South America that fell to placental animals when the drop of sea level connected N. and S. America over the Isthmus of Panama, and much more.
- Mountain-building with earthquakes, and volcanoes, traumatic locally for earthly residents and also inducing swings of the Earth’s greenhouse effect… to the limit of causing mass extinctions of organisms.